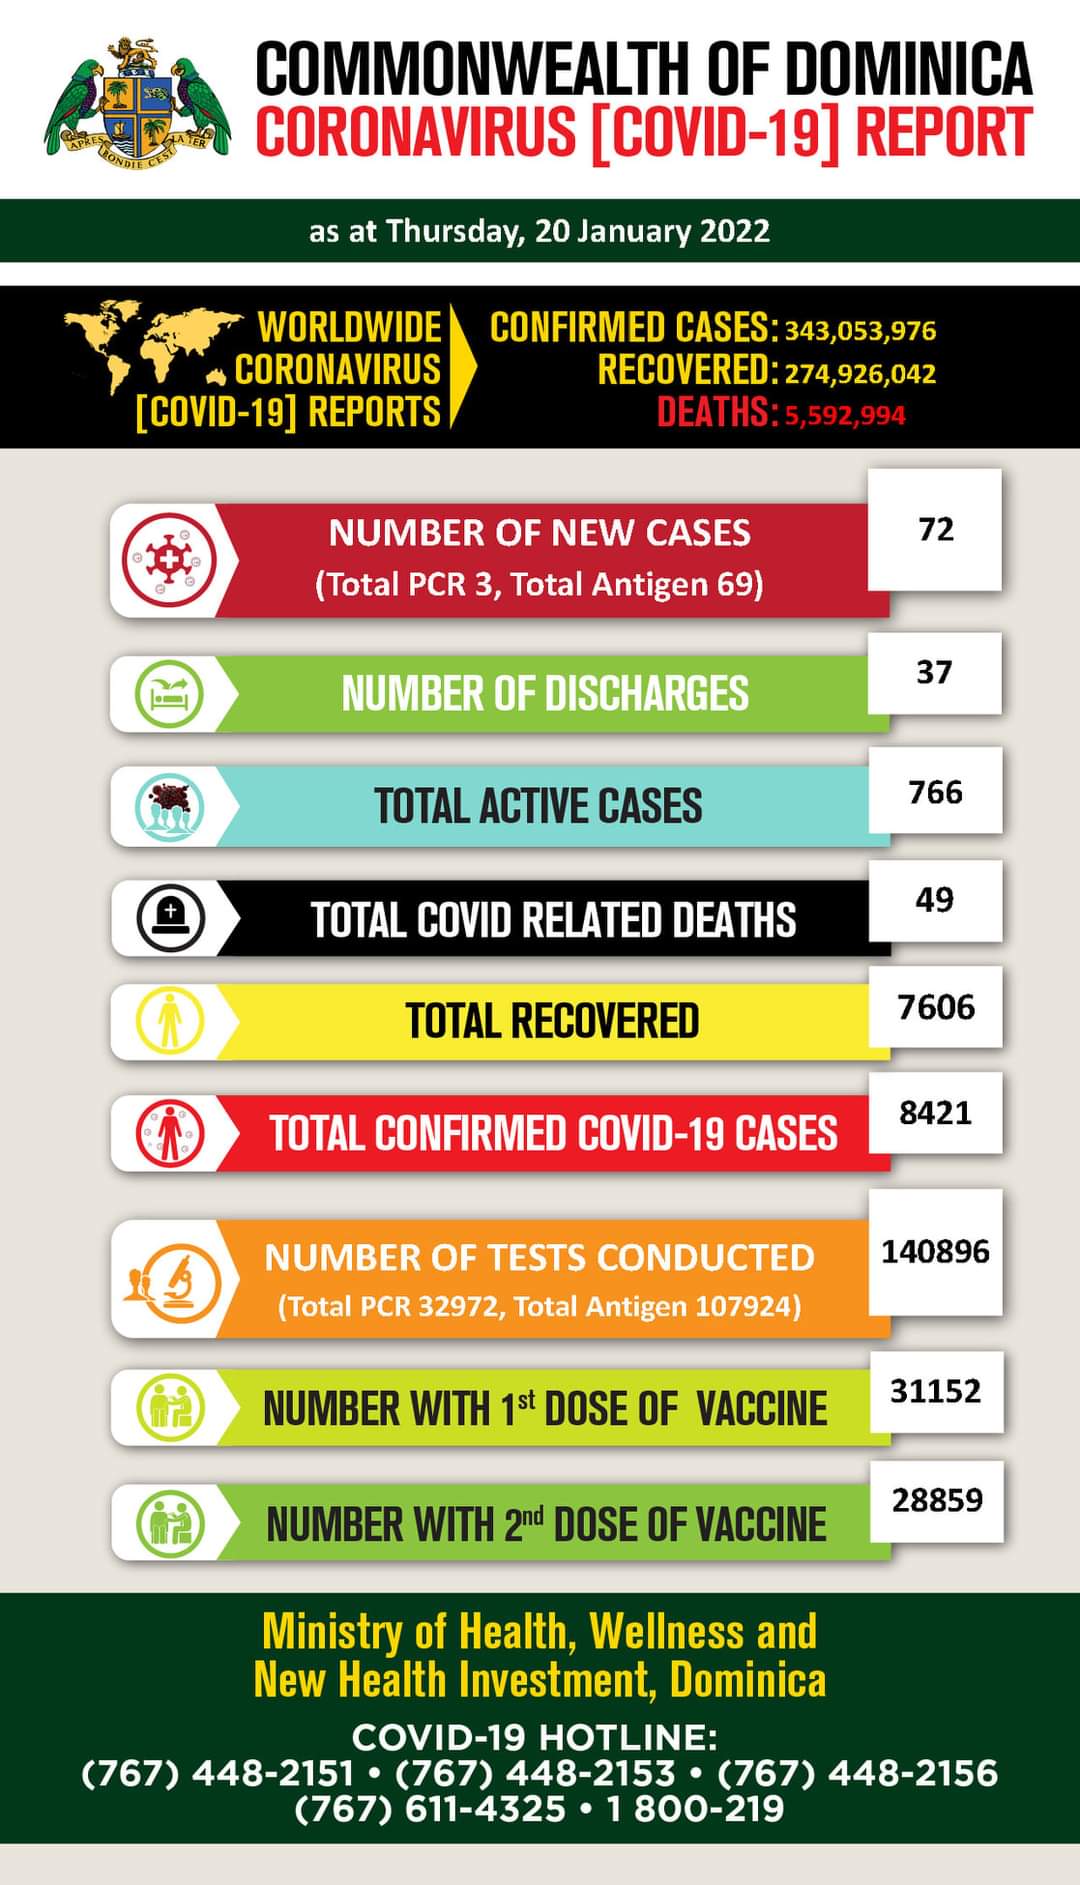
COVID-19 statistics for Dominica as of 20th January 2022

Copyright 2012 Dominica News Online, DURAVISION INC. All Rights Reserved. This material may not be published, broadcast, rewritten or distributed.

Disclaimer: The comments posted do not necessarily reflect the views of DominicaNewsOnline.com and its parent company or any individual staff member. All comments are posted subject to approval by DominicaNewsOnline.com. We never censor based on political or ideological points of view, but we do try to maintain a sensible balance between free speech and responsible moderating.

We will delete comments that:

  • contain any material which violates or infringes the rights of any person, are defamatory or harassing or are purely ad hominem attacks
  • a reasonable person would consider abusive or profane
  • contain material which violates or encourages others to violate any applicable law
  • promote prejudice or prejudicial hatred of any kind
  • refer to people arrested or charged with a crime as though they had been found guilty
  • contain links to "chain letters", pornographic or obscene movies or graphic images
  • are off-topic and/or excessively long

See our full comment/user policy/agreement.

3 Comments

  1. Chakademus
    January 24, 2022

    May I suggest a graph showing how the numbers change over time. Some of us prefer visual information, also this format will be useful to show context of how the disease changes over time. Numbers in isolation are of limited value.

  2. Aa
    January 22, 2022

    How comes We do not hear about the persons who die anymore. In the beginning We heard so much about underlying cases. I guess that dear now. Too cho to flam, or that is not important anymore. Time to close covid center.

Post a Comment

Your email address will not be published. Required fields are marked *

:) :-D :wink: :( 8-O :lol: :-| :cry: 8) :-? :-P :-x :?: :oops: :twisted: :mrgreen: more »

 characters available